
 Sign in with Google
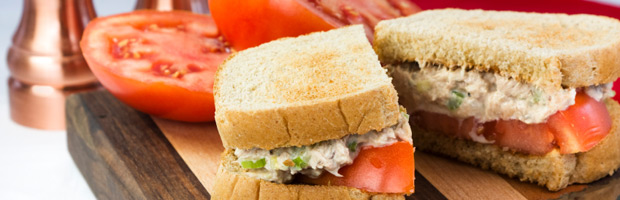
 Okay, so your tuna fish sandwich probably isn’t worth a couple grand. It’s most likely made with a type of tuna called albacore. But, on the docks in Tokyo different kind of tuna, related to the stuff in your sandwich, is sold for $70,000 dollars a fish. The Japanese praise the blue fin tuna, or maguro, as a delicacy. To see what a maguro looks like and how it is eaten, visit
Grades 3-5
Teach Producers and Consumers using Sloth and Squirrel in a Pickle
This economics and personal finance lesson takes students through the process of producing a good to sell to a fictional...
Key Concepts: Consumers, Income, Producers


